recently i was interviewed by Surges and this question hit me:
“Have you got advice for others wanting to create their own marketing tool?”
it would have been easy to say “get feedback from users!” or “just ship a landing page!” — the usual drivel marketers proselytize.
instead i wrote this post.
introducing the SaaS I/O Framework
here’s a handy model you can take to the bathroom:
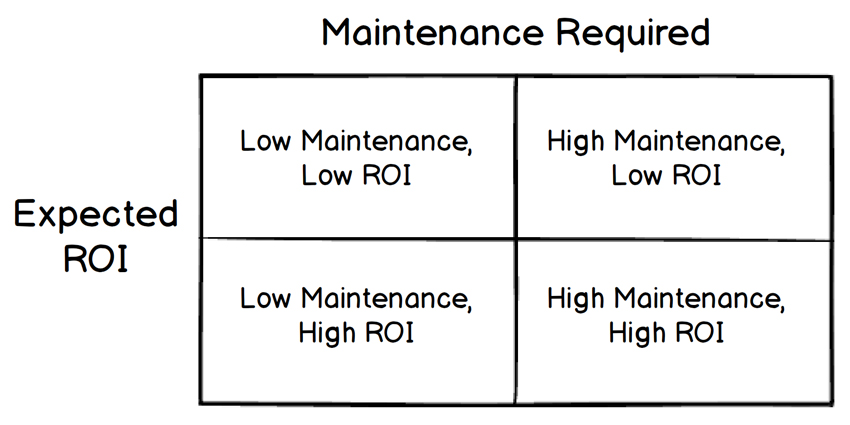
the Y-axis represents tradeoffs customers make to achieve specific outcomes. the X-axis represents tradeoffs companies make to deliver those outcomes.
the SaaS I/O Framework helps companies understand the inputs and outputs of their solutions and achieve the optimal balance of both.
quadrants of opportunity
let’s assign each zone a number, from top left to bottom right.
Quadrant 1 – Low Maintenance, Low ROI
Quadrant 2 – High Maintenance, Low ROI
Quadrant 3 – Low Maintenance, High ROI
Quadrant 4 – High Maintenance, High ROI
since there are successful solutions in every quadrant, choosing how to position your products is more a personal preference than best practice.
Quadrant 1 – Bottom Feeders
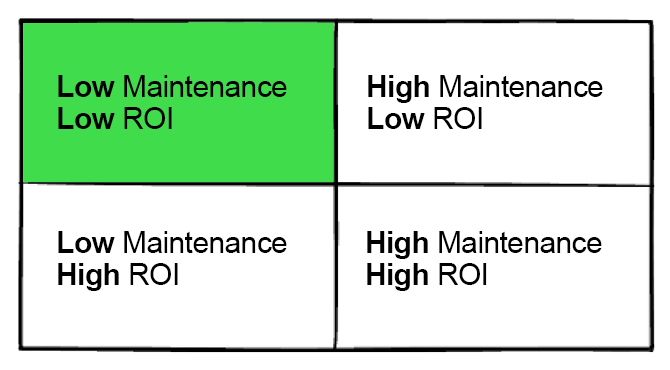
typically these products “teeter” at the inflection point of Build vs Buy decisions.
the notion of paying even a small (but recurring) fee for products in this quadrant is painful on principle, even if financially worthwhile in the long-term.
a few examples:
- server logging apps
- Facebook fan pages
- branded swag giveaways
a popular way people describe products in this category is “Micro SaaS” but i don’t think that’s fair.
any sufficiently built technology provides ROI given affordable inputs (maintenance + price). only insufficient technologies yield low ROI, so if you have one it better darn be low maintenance, too.
Quadrant 2 – For Suckers
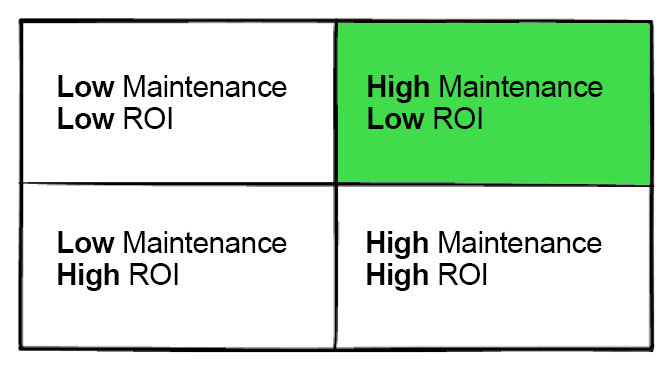
most seed-stage startups fit this description.
juggling “trigger” email alerts to keep the product alive, stakeholders essentially perform group CPR until the platform fails.
a few examples:
- Goodreads
- on-premise servers*
- niche social networks
*the ROI of hosting content yourself is often security related vs performance or scalability. in this framework we measure ROI as money saved or money earned.
Quadrant 3 – Under the Radar
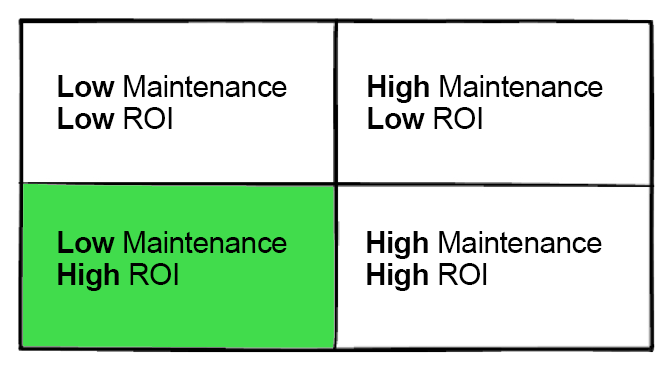
products in this quadrant don’t capture as much value ($$) but they also don’t incite Build > Buy alternatives, require fancy engagement strategies, or spend much on new user acquisition.
a few examples:
most successful side projects and “Four Hour Work Week” businesses live here.
a common sentiment by customers of these products is “set it and forget it.” this enables makers to focus on the Main Thing vs annoying side schemes that drive attention to the Main Thing.
put another way, Quadrant 3 products are the best products because engineering is spent on the solution instead of the solution’s whistle. and because these products are excellent, customers love them enough to share, further reducing distribution complexity.
Quadrant 4 – Swinging for the Fences
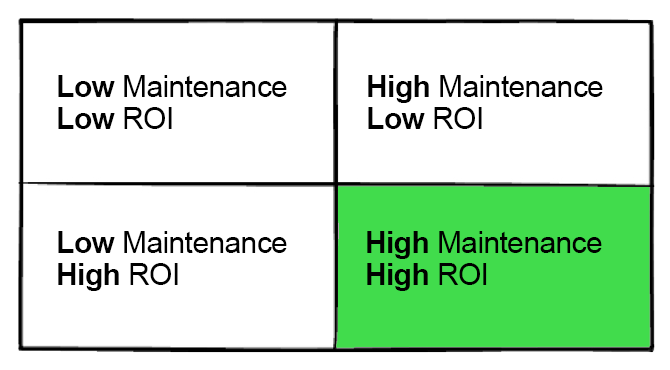
venture-backed businesses that should be venture-backed dominate this category.
while they demand significant attention and resources from customers, they also provide tremendous value. since the clientele of these solutions is “in it” for the long haul, solution providers can afford to invest heavily in advanced functionality and intellectual property.
a few examples:
- Shopify
- Google Data Studio
- Eloqua
- most CRMs
- AWS
- Microsoft Excel
i include Shopify to showcase that Quadrant 4 does not necessarily mean “expensive,” yet it does imply total ownership of its Job To Be Done. for example, nobody has both a Shopify and BigCommerce store. or if they do, it’s very painful.
products in Quadrant 4 often have ecosystems to support them — consultant marketplaces, Expert directories, app stores — in order to onboard new clients. if you prefer a litmus test, whenever a solution says “all in one for _____” it’s probably swinging for the fences.
nuance abounds
you may disagree with my examples. this highlights how Quadrant 1 solutions at my business could be Quadrant 3 solutions at yours.
in modular scenarios such as Intercom’s live chat + knowledge base + ticketing products, customers get to decide what degree of pain (maintenance) they’re willing to tolerate for a desired level of ROI.
regardless of a company’s quadrant, the natural progression of all technology is to increase ROI while decreasing user inputs. a Quadrant 3 business today (low maintenance, high ROI) may look like a Quadrant 2 business (suckers-only) next year. Uber’s shift from fare calculator → estimated fares → guaranteed fares illustrates this evolution.
some products are more easily sold to large businesses who can afford high maintenance costs. setting up Salesforce at a small landscaping company, for example, would likely not be worth the up-front configuration despite only costing $25 per month.
how to build a balanced solution
first, identify where your product lives. then, decide if you are OK with that.
if not, consider the following ideas to streamline acquisition, onboarding, and retention metrics:
- acquisition – offer your product a la carte; be candid about the level of commitment your product requires and the Right Customer will tune in
- onboarding – instead of routing new signups to sales engineers, empower them to do it themselves with video tutorials or knowledge base articles
- retention – don’t tell customers what to do, show them what you already did for them; at Fomo we offer machine learning and weekly ROI email reports
as makers like you realize their “quadrant reality” they can attract candidates with the same inputs:outputs expectations that their solution provides.

love it! a simple way to analyze a business model, and the examples given for each quadrant gave it context and makes it easier to understand what you mean. Thanks.
totally makes sense. most products i use easily fit into one of these categories.